Introduction
ROI curves depict the predicted return on investment (ROI) at various spending levels. A simple illustration is a marketer contemplating the ROI of a paid advertisement campaign. The ROI curve shows the predicted return on investment for every dollar spent on the campaign. As spending increases, the ROI typically rises initially but eventually levels off or even declines. This is because the initial spending brings in new customers, but as spending continues, the cost of acquiring additional customers increases, and the return on investment diminishes.
Factors Affecting ROI Curves
Several factors can affect the shape of an ROI curve. These include the:
- Market: The size and competitiveness of the market
- Product: The attractiveness and uniqueness of the product
- Pricing: The price of the product and its competitors
li>Promotion: The effectiveness of the marketing and advertising campaign
Using ROI Curves
ROI curves can be a valuable tool for businesses in making marketing decisions. They can help businesses to:
- Set budgets: ROI curves can help businesses to set realistic budgets for their marketing campaigns by showing them the expected return on investment at different spending levels
- Allocate resources: ROI curves can help businesses to allocate their resources more effectively by showing them which marketing activities are generating the highest return on investment
- Evaluate performance: ROI curves can help businesses to evaluate the performance of their marketing campaigns by comparing the actual ROI to the predicted ROI
Limitations of ROI Curves
ROI curves are a useful tool, but they also have some limitations. These include the:
- Uncertainty: ROI curves are based on predictions, and the actual ROI may vary from the predicted ROI
- Complexity: ROI curves can be complex, and it can be difficult to interpret them accurately
- Data requirements: ROI curves require data on costs and revenue, which may not always be available
Conclusion
ROI curves can be a valuable tool for businesses in making marketing decisions. However, it is important to be aware of the limitations of ROI curves and to use them with caution.
Understanding ROI Curves
Picture this: you’re investing in a new marketing campaign, hoping to boost your return on investment (ROI). As you pour more money into the campaign, you expect your ROI to climb higher and higher, right? Well, not quite. ROI curves tell a different story, revealing that there’s a limit to how much ROI you can expect as you increase your investment. Like a roller coaster reaching its peak, the ROI curve eventually starts to dip, indicating diminishing returns as your investment grows.
ROI Curves: A Closer Look
ROI curves aren’t just theoretical constructs—they’re based on real-world data and observations. Imagine a company that invests in a new product launch. Initially, each additional dollar invested in marketing generates a significant increase in sales and ROI. However, as the company continues to pump more money into advertising, the incremental gains start to shrink. Eventually, they reach a point where each additional dollar invested results in only a marginal increase in ROI. This is the point where the ROI curve peaks and begins to flatten out.
Now, let’s take a closer look at the different phases of an ROI curve:
- Increasing Returns: In the early stages of an investment, each additional dollar invested generates a disproportionately large increase in ROI. This is the “sweet spot” where the company sees the most bang for its buck.
- Diminishing Returns: As investment continues, the ROI starts to taper off. Each additional dollar invested still generates a positive ROI, but the gains are smaller compared to the initial investment.
- Negative Returns: There comes a point where investing more money actually leads to a decrease in ROI. This is the danger zone, where the company is essentially losing money on its investment.
Understanding ROI curves is crucial for making smart investment decisions. By recognizing the limits of ROI and the point of diminishing returns, you can avoid overinvesting and focus your resources on strategies that will yield the greatest returns.
**ROI Curves: Unlocking Optimal Investment Decisions**
Imagine yourself standing before a choice: invest heavily now or adopt a more conservative approach? The answer lies in understanding the elusive concept of ROI (Return on Investment). But how do you navigate the complexities of investment decisions with confidence? Enter ROI curves, the indispensable tool that can illuminate your path to financial success.
Benefits of Using ROI Curves
ROI curves are more than just graphs; they are decision-making powerhouses. Let’s delve into the myriad benefits they offer:
**1. Clarity in Investment Decisions:**
ROI curves eliminate the guesswork from investments. By visualizing the relationship between investment and return, organizations can pinpoint the optimal investment level that yields the highest possible ROI.
**2. Quantifying Investment Value:**
ROI curves assign a tangible value to investments, allowing decision-makers to compare different projects side-by-side. This quantitative approach provides a solid basis for prioritizing investments.
**3. Optimal Resource Allocation:**
ROI curves help organizations allocate their resources wisely. By identifying the investments with the greatest potential for return, organizations can focus their efforts on initiatives that drive maximum value.
The Anatomy of an ROI Curve
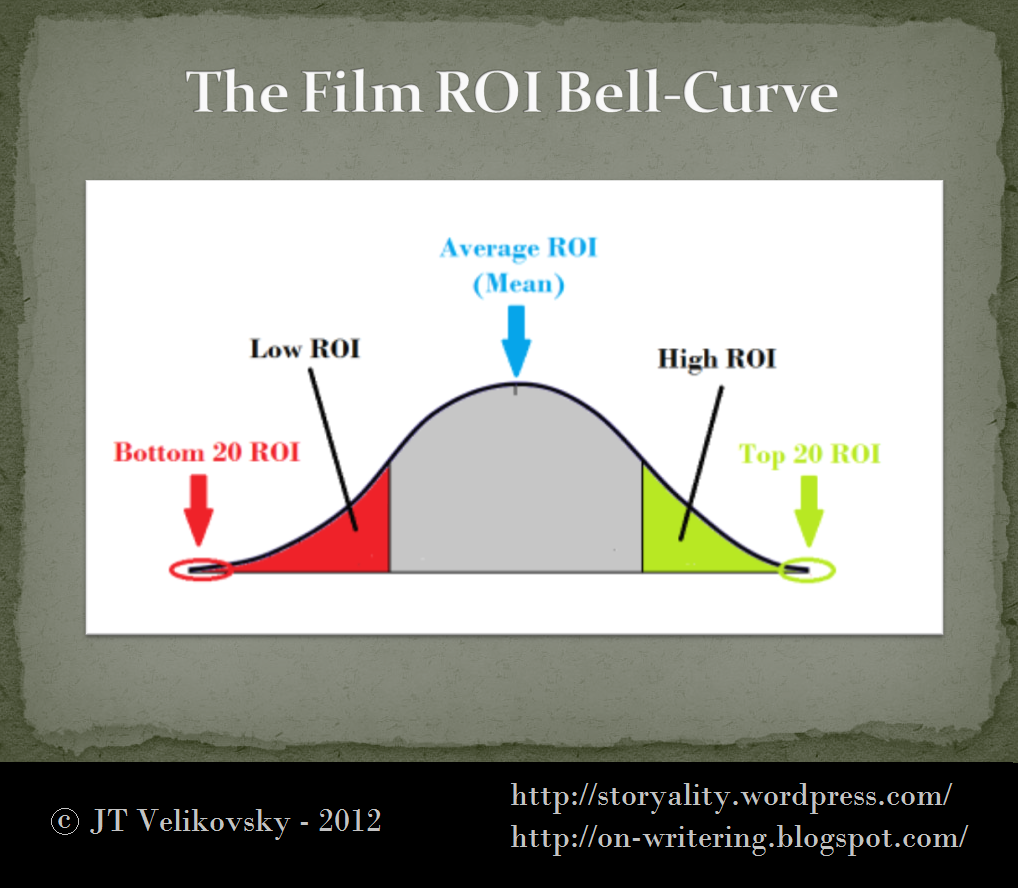
An ROI curve typically follows a bell-shaped pattern. As investment increases, the ROI initially rises, reaching a peak at the optimal investment level. Beyond this point, as investment continues to grow, the ROI begins to decline.
Understanding this pattern is crucial for maximizing ROI. By identifying the inflection point where ROI starts to decrease, organizations can avoid over-investing and optimize their returns.
ROI Curves in Practice
ROI curves have practical applications in various industries. For instance, marketing teams use them to determine the optimal advertising budget that generates the highest customer conversion rates. Investment firms rely on ROI curves to identify stocks with the greatest potential for capital appreciation.
No matter the industry, ROI curves empower decision-makers with the insights they need to maximize returns. They are the financial compass that guides organizations towards investment success.
**ROI Curves: A Journey Through Investments**
The ROI curve, a picturesque representation of an investment’s return over time, resembles a roller coaster ride—sometimes exhilarating, sometimes bumpy. Understanding the factors that influence these curves is like navigating a labyrinth, revealing the secrets to maximizing returns.
**Factors Influencing ROI Curves**
Numerous factors, such as industry trends, market saturation, and customer acquisition costs, can impact the shape and slope of ROI curves. It’s akin to a symphony, with each element playing a harmonious or dissonant note. For instance, a booming industry might propel the curve upward, while intense competition could drive it downward.
**4. Customer Acquisition Costs: The Gatekeeper to Returns**
Customer acquisition costs (CAC) are like the tollbooth on the road to profitability. High CACs can dampen the ROI curve, making it harder to reach the break-even point. Imagine spending a fortune on marketing campaigns only to find that the resulting customers generate meager returns. On the other hand, low CACs grease the wheels of profitability, accelerating the rise of the ROI curve.
**5. Competition: Navigating the Shark-Infested Waters**
Market saturation and competition can be like treacherous reefs in the sea of ROI. When the waters are teeming with rivals, it becomes harder to stand out and capture customers. In such a scenario, the ROI curve might struggle to gain traction, flatlining or even dipping into negative territory. However, in markets with low competition, there’s ample room to maneuver, and the ROI curve can flourish.
**Conclusion**
Understanding the factors that shape ROI curves is like deciphering a secret code. By carefully considering industry trends, market saturation, customer acquisition costs, and competition, investors can make informed decisions that maximize returns. Just as a skilled navigator charts a course to avoid hidden obstacles, investors can navigate the ROI curve to achieve financial success.
ROI Curves: Unveiling the Path to Optimal Returns
Imagine a graph representing your return on investment (ROI) as you pour in more resources. At first, the curve soars upwards, indicating a healthy return for your efforts. However, as you continue investing, the curve inevitably flattens out, signaling diminishing returns. This is the ROI curve, a powerful tool that helps businesses optimize resource allocation and maximize profits.
Applications of ROI Curves: Empowering Strategic Decision-Making
ROI curves extend their reach far beyond the boundaries of a single industry. From marketing and sales to product development, businesses across the board leverage their insights to guide their investments:
- Marketing:
- Sales:
- Product Development:
ROI curves guide marketing campaigns, ensuring that each dollar spent yields the greatest possible return. By analyzing the ROI of different channels, marketers can allocate resources wisely and maximize their reach.
Sales teams use ROI curves to identify the most effective sales techniques, target the right customers, and optimize their closing rates, ultimately boosting revenue and profitability.
ROI curves can provide valuable insights during product development, ensuring that resources are invested in features that drive the highest customer value and ROI.
Understanding the ROI Curve: A Visual Guide to Profitability
The ROI curve follows a distinct pattern, with the horizontal axis representing the investment level and the vertical axis representing the return. Initially, the curve rises sharply, denoting a high ROI for each additional investment. However, as investments increase, the curve inevitably plateaus, indicating that further investments yield progressively lower returns.
When to Invest and When to Hold Back: Decoding the ROI Curve
The ROI curve serves as a compass, guiding businesses in their investment decisions. By identifying the point where the curve flattens out, businesses can determine the optimal investment level to achieve the highest possible ROI. Continuing to invest beyond this point may result in diminishing returns, while investing less may limit potential profits.
Conclusion: ROI Curves as a Strategic Imperative
In a world where resources are finite, ROI curves empower businesses to make informed decisions that maximize returns. By understanding the ROI curve, businesses can optimize resource allocation, drive profitability, and stay ahead in the competitive landscape.
ROI Curves: Demystifying the Power of Return on Investment
Imagine investing in a groundbreaking venture, pouring your heart and soul into its success. As the project unfolds, you eagerly track its progress, keeping a watchful eye on the returns it generates. This is where ROI curves step onto the scene, offering a roadmap to visualize the relationship between your investments and the rewards you reap.
ROI curves depict a graphical representation of the return on investment (ROI) at different levels of investment. They resemble a bell-shaped curve, starting at zero investment, rising as investment increases, and eventually flattening out or even declining as investment reaches its peak. This curve empowers you to understand how your investment strategy translates into tangible returns, helping you make informed decisions about your financial ventures.
Limitations of ROI Curves
As valuable as ROI curves can be, it’s essential to acknowledge their limitations. One caveat lies in their reliance on assumptions. They assume a predictable market and linear growth, which may not always hold true in the real world. Unforeseen market conditions, such as economic downturns or technological disruptions, can lead to deviations from the projected ROI curve.
Moreover, ROI curves often fail to capture the qualitative aspects of investments. They don’t account for factors such as customer satisfaction, brand reputation, or employee morale, which can significantly impact the long-term success of a venture. By solely focusing on financial returns, ROI curves provide a limited perspective on the overall value of an investment.
Furthermore, constructing ROI curves requires accurate data and precise forecasting, which can be challenging in practice. Market dynamics are constantly evolving, making it difficult to predict future outcomes with complete certainty. As a result, ROI curves may not always provide a perfect representation of the actual ROI you’ll achieve.
Despite these limitations, ROI curves remain valuable tools for understanding the potential return on investment. They offer a framework for evaluating investment decisions, allowing you to compare different options and make strategic choices. However, it’s crucial to use ROI curves in conjunction with other financial analysis tools and qualitative considerations to gain a comprehensive understanding of the risks and rewards involved.
**ROI Curves: A Guide to Maximizing Investment Returns**
Introduction
Imagine a rollercoaster ride where the thrill is equivalent to the return on investment (ROI) of a project. As you climb the initial slope, excitement builds with increasing ROI. But, just like a rollercoaster, there’s a point where the curve flattens or even dips, indicating diminishing returns. This is where ROI curves come into play.
What is an ROI Curve?
An ROI curve is a graphical representation of the relationship between investment and return. It plots the ROI as a function of the investment amount. The curve typically starts with a steep incline, representing high ROI for small investments. However, as investment increases, the ROI gradually decreases, eventually reaching a point of diminishing returns.
Benefits of Using ROI Curves
ROI curves provide several benefits to organizations:
- Visualize the impact of investment decisions
- Identify the optimal investment level for maximum return
- Compare alternative investment options
Limitations of ROI Curves
Despite their usefulness, ROI curves have some limitations to consider:
- Reliability of Data:
- Subjectivity of Assumptions:
- Unpredictability of Future Returns: ROI curves assume future returns will follow historical patterns, but market dynamics and other factors can disrupt these assumptions.
- Long-Term Perspective:
- Complexity for Complex Investments: ROI curves can be challenging to apply to complex investments with multiple variables and interdependent factors.
Best Practices for Using ROI Curves
To effectively utilize ROI curves, follow these best practices:
- Use reliable data and assumptions
- Consider both qualitative and quantitative factors
- Test the sensitivity of the curve to different assumptions
- Integrate ROI curves into the decision-making process
Conclusion
ROI curves are valuable tools for organizations to make informed investment decisions. By understanding their benefits and limitations, organizations can effectively optimize their investment strategies. However, it’s crucial to use ROI curves judiciously, considering their inherent uncertainties.
- Subjectivity of Assumptions: